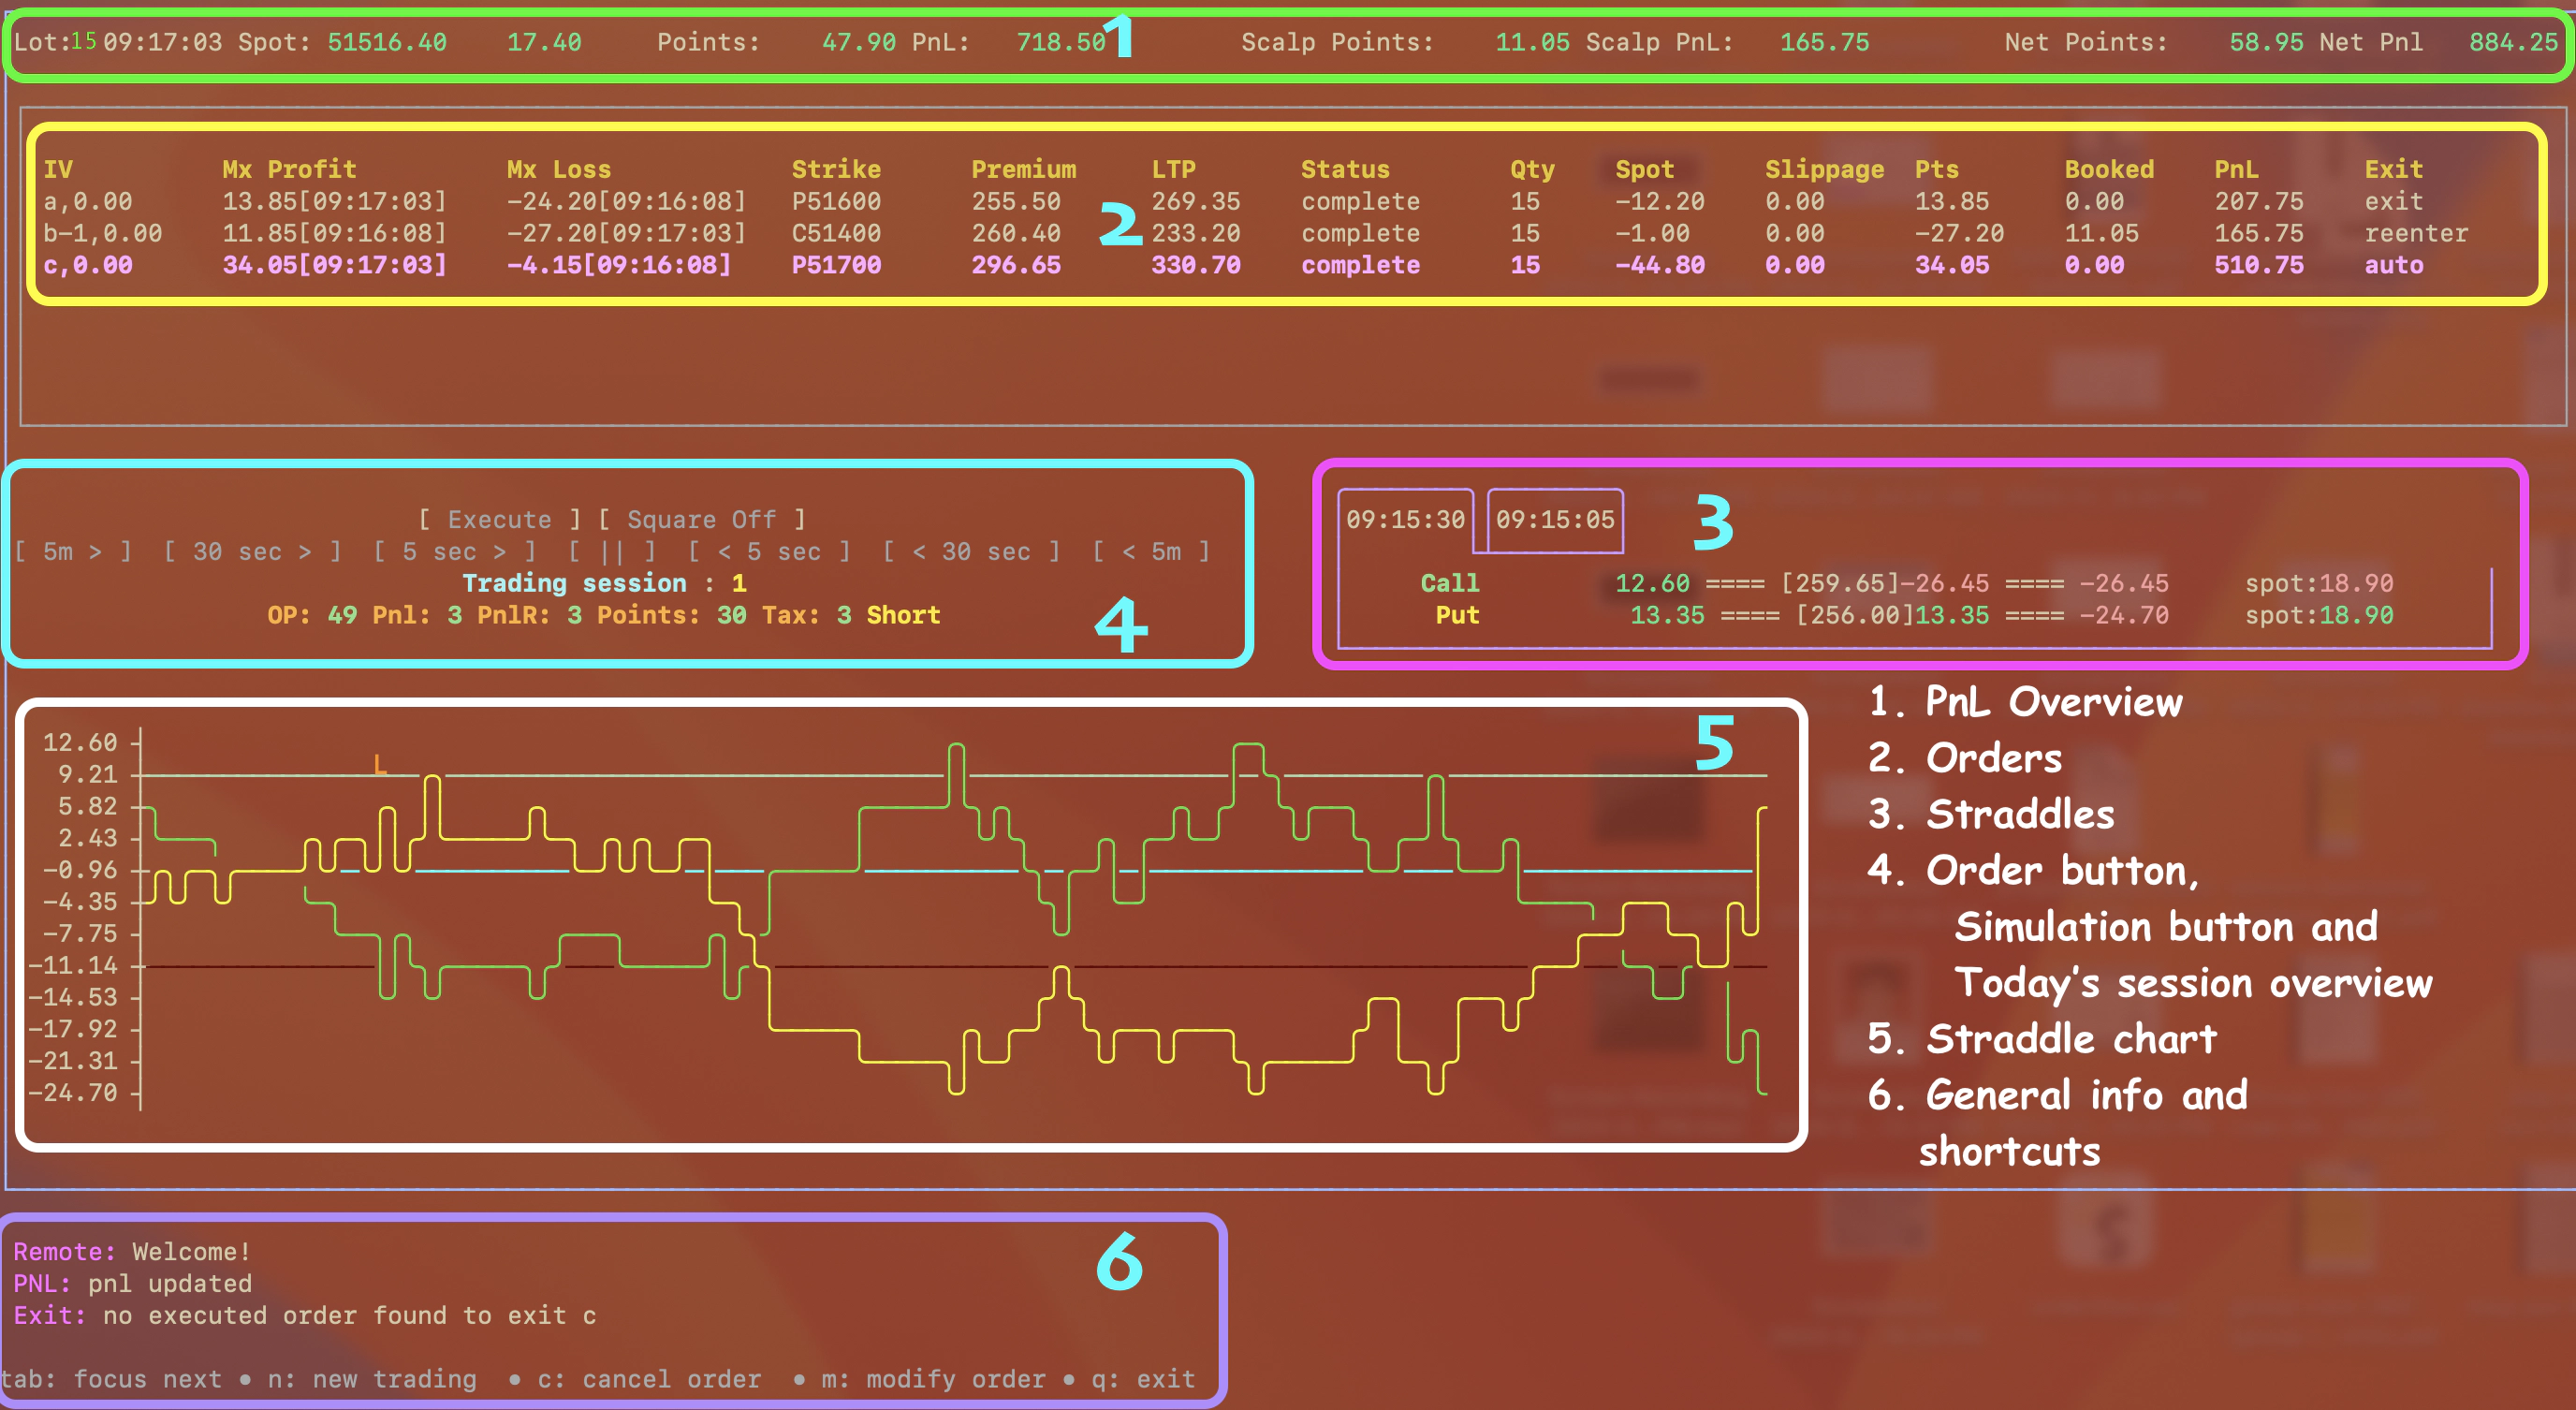
Understanding Scalper terminal
Exchange
NSE
Strategy
Straddle
Instrument
BankNifty

Scalper terminal contains 6 panels in total. Go through the image below, each panel is numbered and what it’s meant for.

1. Pnl Overview
 It contains the following information
- lot size
This is the lot of size you selected for scalping - spot price:
<spot_price> <space> <points_moved_from_today_open>
In this case BankNifty is at51516.10, which is+17.10points from today’s open - Points, Scalp points and Net points
indicate profit/loss for the current session, shown in format<points> <space> <points * quantity>- Points: points of live order. In this case combined points of put 51600 and 51700
- Scalp Points: points of orders that are squared off. In this case, we
booked 11.05 points by buying and selling call 51400 - Net Points: is sum of Points + Scalp Points. In this case
gain of 58.95 points and profit of ₹884.25
2. Orders
 Order table shows order that is executed and exited
- IV shows the IV of current call/put strike
- Mx Profit is max profit for the executed order, call/put has reached
- Mx Loss is max loss for the executed order, call/put has reached
- Strike is the strike price of the executed call/put order
- Premium is the premium paid to execute the order
- LTP is the last traded price for the order
- Status is the state (open, pending, complete or rejected) for the of executed order
- Quantity of order
- Spot has moved after the execution of order
- Slippage it the price you originally requested vs. the price you got after modifying the price to execute the order
- Pts is the point gain/lost for the executed order
- Booked are the points booked. sell price minus buy price
- PnL is profit/loss in Rupees
- Exit the order that is bought or sold can be exited by placing the corresponding sell or buy order
3. Straddles
 Straddle is exact replica of your strategy, and you can preview the first two orders in your strategy.
Press shift + D and you will see, in this case,
- time of the straddle in a tab
- the call and put strike,
- the max profit and loss and
- spot move since the straddle execution
Every time you pressShift + Dyou will see a new straddle and you can switch between straddles tabs by pressingd
4. Execution
 Row 1
Row 1
This is the control panel of your orders. You have Execute and Square off button
Navigate to this panel, over execute button by arrow key and then hit Enter key to execute next order in your strategy or hover to square off and hit Enter key to exit all live orders
Row 2: Simulation controls
They can only be used when doing simulation to fast-forward or rewind simulations
Row 2: Trading sessions
This shows the overall PnL for the given day along with tax. Numbers are indicative in the above image and not real
- OP: number of orders remaining for given day
- Pnl: from all trading sessions for given day.
- Points: total points from all trading sessions for given day.
- Tax: total tax for given day
Short/Long this is the current strategy, can be changed by pressing Shift + S to go short or Shift + L for long.
In this case user is playing Long, so the first order will be buy call
5. Straddle chart
 This is the line chart for straddles seen in Straddle panel.
When you switch the straddles in the starddle panel with
 d, this line chart also updates
blue line is the 0 point line
green and red line is +/- 10 points line from zero
6. General and shortcut Information panel
 Displays the information about connections, order status, strike any general information
Help menu below shows the shortcuts for quick help during trading
